
Graph
When you learned about polynomial equations, like quadratics, you had graph. Then, what happen when you graph trig values?
Before we actually look at the graphs, let's think about it first. Draw a unit circle in your mind. You already know that cos value is the x value and sin value is the y value of the point. What will be domain or range? For both cos and sin, they can't be bigger than 1 or smaller than -1 because the point is always on the unit circle. Then, we can find that range will be -1≤cos≤1 and -1≤sin≤1. What about domain? You now know the angle over 360 or smaller than 0 too, so domain can be any number.
*For trig graphs, we usually use radian instead degrees because the value of degree is too big; 360 degrees while y is from -1 to 1, but radians is 2π (6.28...) instead 360º. I will also use radians here.*
Now, look sin and cos separetely. First, sine graph.
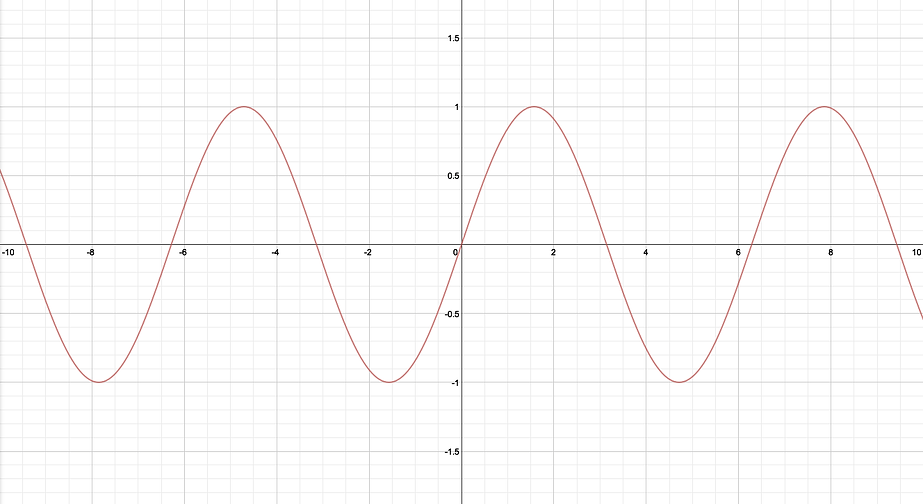
Sine is y value. Domain from 0 to π/2, y value is positive number, and it increases. From π/2 to π, y is still positive, but it decreases. When x is from π to 3π/2, y value is negative, and still decreasing. From 3π/2 to 2π, it is still negative value but increases. You might understand better with the animation below.
Because of this change, sin graph will look like above. The graph repeats and repeats because over 2π, sin value will be same as from 0 again.
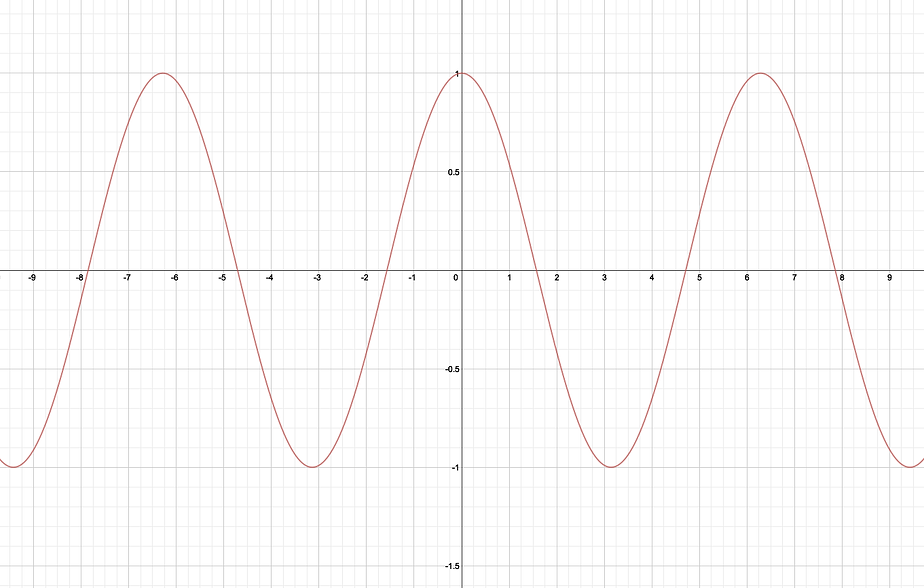
Now, cosine.
Cos is y value. Domain from 0 to π/2, x value is positive number, and it decreases. From π/2 to π, x is negative, and it still decreases. When x is from π to 3π/2, y value is still negative, but start increasing. From 3π/2 to 2π, it is positive value now and still increases. There is another animation.
Tangent. Well, tan graph is harder to see straight away, because it isn't a value of x or y but the slope. Therefore, read the description very carefully, and draw the unit circle and graph in your mind.
First, when the angle is 0, the slope is also 0 because it is horizontal graph, constant function. What about π/4? It will make a isosceles right trangle, which means y=x, slope is 1. When the angle is almost, very close to π/2, but not π/2? The slope will be infinite because it is almost parallel with y-axis. However, when the angle is exactly π/2, it can't have slope because perpendicular line on graph is not a function. When the angle is slightly bigger than π/2, the slope is very small, and negative number. It will increase until 3π/2 (π will be 0 again), and undefined again when the angle is 3π/2.
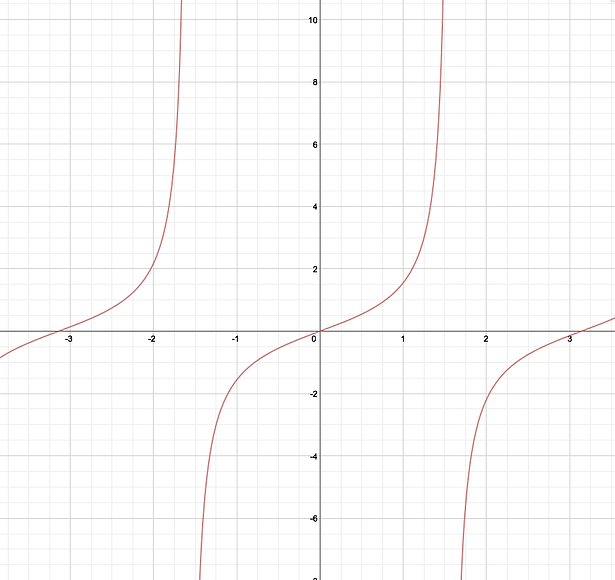
The graph looks like this. There is another way to understand. How can you find the slope of linear function? Rise over Run or change of y over change of x, right? When the angle is 0, y is 0 and x is 1. 0/1=1. When angle is π/4, x and y are same, √(2)/2, so the slope will be {√(2)/2}/{√(2)/2}=1. When angle is π, y is 1 and x is 0, so it is undefined. (we can't find the value that denominator is 0)
Analyzing the graph-period/amplitude
If you have anything that want me to explain more or if you have any questions, please leave it on this page.