
Physics-Spring
Quantitative Data
Table 1: The change of the length of the spring affected by the weight (±0.2cm)
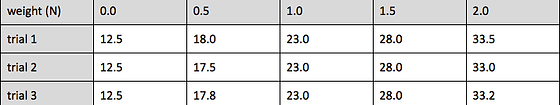
Justify the amount of uncertainty in the measurement of the dependent variable.
Uncertainty of the length of the spring is ±2mm(0.2cm). The ruler stick’s uncertainty is 1mm, but when we read it, hands were not always accurately on the start of spring which must affected on the result. Because of that, our team thought it is about ±2mm, not ±1mm.
Associated Qualitative data (observations)
When we hang the weights on the spring, the spring bounced up and down which makes measuring difficult and not accurately. Therefore, we had to hang weights carefully and stop the weight with hands when it bounces.
Also, I thought the spring will extend always in same rate before I actually measured. And the result was exactly as I thought. It surprised me that I was right.
When we put 2N, the spring was already stretched enough that the weight will touch the desk, so we moved spring so that stand is on the edge of the desk and spring can go all the way down to the ground. The result was collected through this process.
Table 2 : The extension of the spring affected by the weight (±2.5mm)
|
|
Weight (N) |
0.0 |
0.5 |
1.0 |
1.5 |
2.0 |
|
Trial (mm) |
1 |
0 |
55 |
105 |
155 |
210 |
|
|
2 |
0 |
50 |
105 |
155 |
205 |
|
|
3 |
0 |
53 |
105 |
155 |
207 |
|
Mean extension |
|
0 |
53 |
105 |
155 |
207 |
|
Range (max-min) |
|
0 |
5 |
0 |
0 |
5 |
|
1/2 range |
|
0 |
2.5 |
0 |
0 |
2.5 |
Determining the Mystery Weight
Table 3: Measure the weight of mystery weight with a regular spring
|
mystery weights |
Extension (mm) (y) |
Weight (N) |
True Weight |
Measured-True |
% Error |
|
1 |
365-125=240 |
2.32 |
2.25 |
0.07 |
3.1 |
|
2 |
308-125=183 |
1.77 |
1.66 |
0.11 |
6.6 |
|
3 |
262-125=137 |
1.32 |
1.26 |
0.06 |
4.8 |
(average of error 4.8%)
Graphing Processed Data
Patterns. Trends or Relationships
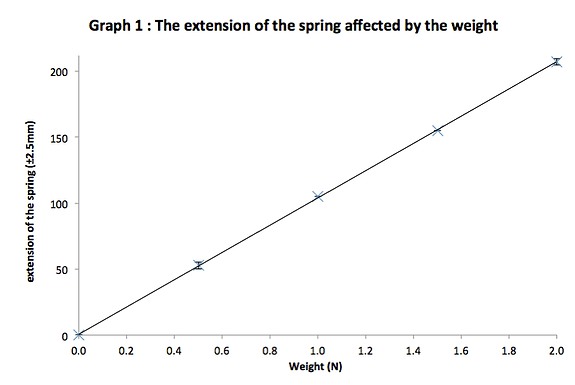
The graph is a linear which means x values and y values always increase or decrease same rate at any point. This graph is a linear graph of slope 103.5 (because every 1N extends length of spring in 103.5mm.) The slope means that the spring will stretch 103.5mm with every 1N added. Therefore, we can predict the extension length of the spring with different weights without measuring by the equation y=105x (x=weights, y=extension of the spring).
The error bar, which is plus or minus half range is maximum 2.5mm, which is the uncertainty of this data. Just by the data I got from the experiment, the graph can’t draw a perfect straight line because of uncertainty and some errors. Error bar helps to make a better-applying graph from these errors.
By the graph, we can see that the spring doesn’t stretch with no weight (0,0), and the extension is increasing proportionally with the mass of weight.
Reliability of the Data
The data is reliable because dependent variables are very close to each other. When I consider the uncertainty, there are almost same all the time. And on the graph, the linear graph doesn’t have much difference with the actual values.
The data is also quite reliable for the mystery weights because first, the error isn’t very big, 4.8%, less than 5%. Also, when we had more trials on the mystery weights, I think we will get less error, which makes the data more reliable.
Conclusion-related with Hooke's Law
Hooke’s Law basically says extension of spring and force is proportional. For example, when the weight hang on the spring gets double, the extension of spring will also be double. My data and graph exactly follows this law. The graph is linear. This means a lot of thing. The slope of the graph is 103.5 [(0+207)/2.0]. This represents that the spring stretches 103.5mm by adding 1N every time (until the elastic limit, where the spring cannot keep its spring force and breaks). In other words, in the formula of Hooke’s Law [y=kx], k for this spring is 103.5. Then, regardless the value of k, it is same that the extension of graph is proportional.
By the law I found by the data and also by research, it is possible to measure the force with normal spring, just as I used on this lab. With different weights, we can find the ‘slope’ of the graph of the extension of spring by weight, which is the ratio of extension of spring by the weight. Then, we measure the extension of the spring with mystery weight, and divide it by the ‘slope’, then we can get the relatively accurate force.
References
Jessa, T. (2013). What is Hooke’s Law?. [online] Retrieved from: http://www.universetoday.com/55027/hookes-law/ [Accessed: 22 Nov 2013].
Wikipedia (2013). Hooke's law. [online] Retrieved from: http://en.wikipedia.org/wiki/Hooke%27s_law [Accessed: 22 Nov 2013].
Written by Nyeong-Min Flora Lee, Nov. 18-25, 2013